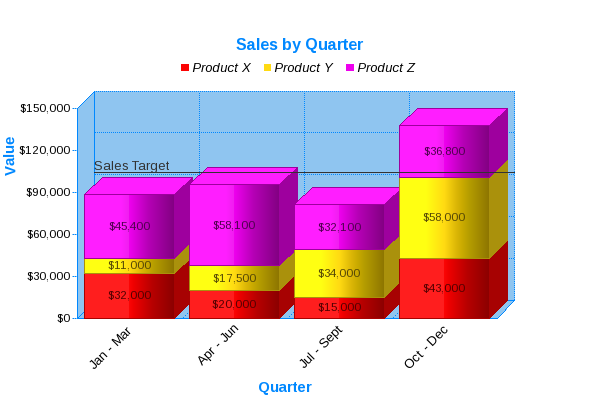
Stacked Bar graphs are a great way to group data and enable the viewer to make comparisons between those groups. In this first example the bar graph is used to show the sales figures by quarter. Note that in this exmample a 'Target' line has been added to provide the viewer with another quick way to compare all the data against a general sales target.
JPowered provides software to enable web developers to easily incorporate dynamic graphs and charts into web sites and applications.
Web Page Graphing Documentation
A series of easy to follow Tutorials have been produced to enable quick development and show some of the more advanced and dynamic applications.