|
Bar graphs comprise an axis and a series of labeled horizontal or vertical bars that show different values for each bar. The
numbers along a side of the bar graph are called the scale.
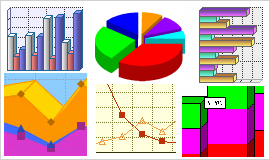
The example below show a horizontal bar graph which displays sales figures by month.
Bar graphs can also be used to display multiple series of data. These are know as double or multiple bar graphs.
The example below shows a multiple bar graph being used to display sales figures for three different products. This time with
a 3D effect applied to the bars to give greater visual impact.
As mentioned above bar graphs can also be vertical. Here is an example of a vertical bar graph.
Another useful type of chart is the Stacking Bar Graph. Here the bars, rather than being displayed side by side, are stacked
o top of each either.

All of the examples above are showing data with positive values. However Bar graphs can also be used to plot negative and decimal
values. The Advanced Graph and Chart Collection contains 4 versions of the bar graph which are all capable of plotting the full
range of numerical values, positive, negative, integer and decimal (or floating point).
Summary
Bar graphs can be used to display a wide variety of information. When data is represented in the form of a bar graph the human
eye finds it very easy to compare the data and quickly draw conclusions. In short they are a great visual aid and will add a touch
of professionalism to any web page or document which requires the display of data.
View more bar graph examples
here »
|
Add Powerful bar graph reporting features to your Web / Intranet pages and
applications.
With the advanced bar graph graphing functionality you will be quickly adding impressive and dynamic charting capabilities bringing
your data alive !


14 Graph and Chart Styles !
New in this Release
From $195 only
Full Money Back Guarantee >>
Main Features Summary
Vertical Bar Graph or Histogram ?
In strict mathematical or statistics terms a vertical bar graph should be called a histogram. However in common day language
people hardly ever talk about histograms they more often than not will refer to the bar graph.
|