|
Providing a graphical representation of data within a web page is easier than one might imagine. With the right piece of software
the task becomes quite straight forward and the graphical results will be impressive.
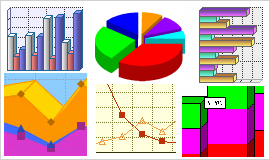
The first thing to decide is what type of graph to use to represent the data. This largely depends upon the nature of the data
and the relationship between the data items. For instance if the data varies over time then a line graph or vertical bar graph
would be far more appropriate than a pie chart. However if the data represented sales figures by region then perhaps a pie chart
would be the best choice.
Typically adding graphical functionality to a web pages involves adding a small amount html code, setting some configuration
settings (like fonts and colors) and supplying the data. The graph software will then read the data and configuration at page
view time and produce the graph image dynamically within the page.
In addition to creating the graph image, the graphical object can also provide the user with interactive features like pop up
value displays upon mouse over and hyper link functionality upon a mouse click.
Why Show Data in Graphical Format ?
Tables of data are well and good but the human eye prefers pictures. By representing data graphically the viewer can take in
a large amount of information in a very short period of time. With a graph any trend within the data becomes easy to spot. Similarly
if any of the data is lower or higher than the norm then this too is immediately obvious to the viewer. Both of these are particularly
important where the graph is representing some sort of performance data.
A good graphical display is pleasing to the eye and therefore can have the effect of impressing the viewer and encourage them
to read more of a page or site. As such a professional looking graph has a positive knock on effect for the rest of a site.
|
Add Powerful graphical reporting features to your Web / Intranet pages and
applications.
With the advanced graphical graphing functionality you will be quickly adding impressive and dynamic charting capabilities bringing
your data alive !


14 Graph and Chart Styles !
New in this Release
From $195 only
Full Money Back Guarantee >>
Main Features Summary
|