|
Note:
For the purposes of demonstration this servlet
implementation assumes that the 2D/3D Line Graph Servlet
has been implemented on the local machine under
the JSDK Servlet engine. It is vital that "ServletRunner"
is in operation when this page is viewed. For
further information on this please see:-
Documentation
- Implementing Servlet
|
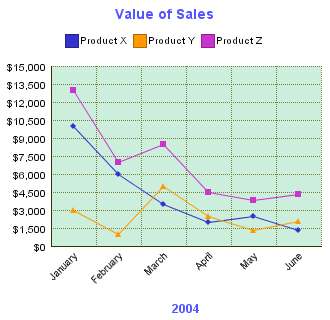
Method Outline
The configuration parameters and chart data are
supplied via two text files (linedata.txt and lineprops.txt).
Settings Summary
- 2D Graphing Mode set
- 3 series of data defined each with 4 quarters
of data.
|
|
How the Chart was created.
The above chart was inserted into the page with
the HTML Code contained in the file,
servlet-multiple-2D-line-graph.txt
(click to view).
The chart properties are read from the file,
../../line_graph/Examples/linepropsM2D.txt (click
to view)
The chart data is read from the file,
../../line_graph/Examples/linedataM2D.txt (click
to view)
|
Further Information
For a full explanation of each parameter see the
"Configuration
Options" section of the Documentation.
|