|
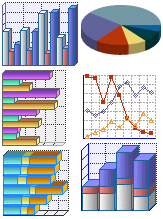
This 2D / 3D Bar Graph Software provides client and server side solutions for the incorporation of bar charts into web pages. They provide versatile components so that web authors and Java developers can easily build and publish dynamic and interactive Bar Graphs.
|
Advanced Graph and Chart Collection
 Save 40% 7 graphing products for the price of 4 ! For more information click here. |
Graphing Articles
Bar graphs comprise an axis and a series of labeled horizontal or vertical bars that show different values for each bar. The numbers along a side of the bar graph are called the scale.
more »
Line Graphs are used to show how two parameters are related to each other. Or to put it another how one variable changes as another changes. A Line graph consists of two axis, a vertical or Y axis and a horizontal or X axis.
more »
Pie charts (or sometimes called circle charts) provide a visual representation of data as slices of a pie. The greater the data value the larger the pie slice. The sizes of each slice are calculated such that the total sum of all the data elements will represent the full 360 degree pie circle.
more »
Bar charts comprise an axis and a series of labeled horizontal or vertical bars that show different values for each bar. The numbers along a side of the bar graph are called the scale.
more »
Line Charts are used to show how two parameters are related to each other. Or to put it another how one variable changes as another changes. A Line chart consists of two axis, a vertical or Y axis and a horizontal or X axis.
more »
Pie graphs (or sometimes called circle charts) provide a visual representation of data as slices of a pie. The greater the data value the larger the pie slice. The sizes of each slice are calculated such that the total sum of all the data elements will represent the full 360 degree pie circle.
more »
Graphical Representation of Numerical Data
Providing a graphical representation of data within a web page is easier than one might imagine. With the right piece of software the task becomes quite straight forward and the graphical results will be impressive.
more »
How to add dynamically generated Graphs and Charts to web pages and applications.
Not so very long ago adding a graph or chart to a web page or application required a fair amount of programming knowledge and was rather time consuming for even the most experienced. However with the tools available today it is possible for almost anyone to add graphs and charts to web pages. With just a little bit of HTML, dynamically generated graphs and charts can be added to web pages and/or applications. more »


