2D Pie Chart

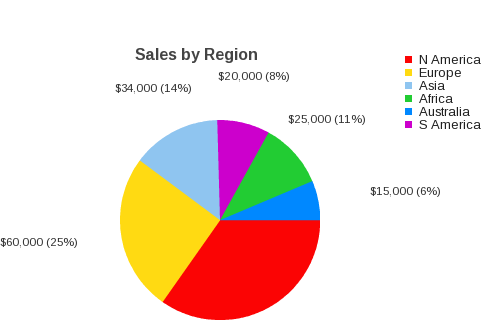
Pie charts are a great way to show a visual comparison between one dimensional data. Here we use a 2D pie chart to compare the value of sales across regions.
The segment sizes are proportional to the size of the data item they represent. In addition to providing a quick comparison between data items it is easy for
the viewer to see how much of the total each segment represents.

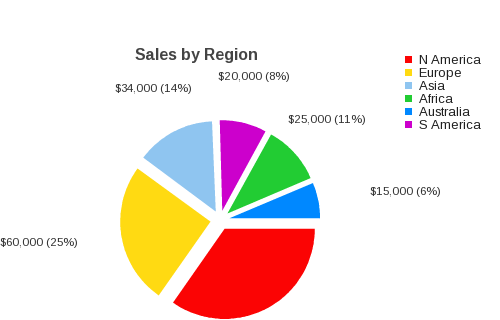
For an added visual impact pie charts can be created in the exploded form to provide an additional emphasis on pieces of data. Here this 2D pie chart has all of it's segments seperated.
Graphs and Charts Software
JPowered provides software to enable web developers to easily incorporate dynamic graphs and charts into web sites and applications.
Web Page Graphing Software
PHP Graphing Software
Java Graphing Software
Full Documentation
PHP Graphing Documentation
Web Page Graphing Documentation
Java Graphing Documentation
Tutorials
A series of easy to follow Tutorials have been produced to enable quick development and show some of the more advanced
and dynamic applications.
PHP Graphing Tutorials
Web Page Graphing Tutorials
Java Graphing Tutorials

Benefits
- Easy to use and integrate
- Fully cross browser
- Platform independent
- Fully customizable
- Enhanced graphics and font rendering
- No client plugins required
- Highly efficient server side graphing
- Printer Friendly
- Dynamic graphing
- Direct database connections
- Technical Support
- Full documentation
- Comprehensive tutorials
- Sample applications
Top Features
- Over 30 chart styles
- 2D/3D Graphing
- Variety of Data Sources (Files, Databases, Scripts/Server processes, HTML parameters).
- Multiple Scales
- Target Lines
- Trend Lines
- Multiple Plots
- Configurable Grid
- Configurable Symbols
- Automatic Legend
- Label Orientation
- Configurable 3D effect
- Free Form Images
- Free Form Text

