This tutorial demonstrates how to implement the graphing software to dynamically read data from a spreadsheet (in this case an MS Excel Spreadsheet).
The following tutorials assume you have already downloaded and installed the
PHP Advanced Graphs and Charts package.
The latest release can be downloaded here
In this tutorial we will be using the open source package 'PHP Excel Reader' package. This package can be obtained from:-
http://sourceforge.net/projects/phpexcelreader/
Once downloaded place the following two files into the ./jpowered/graph/ directory:-
At the time of writing we had to make the following small change to the reader.php file:- We replaced:-
With:-
A good general article on using the 'PHP Excel Reader' package can be viewed at:-
http://devzone.zend.com/article/3336-Reading-and-Writing-Spreadsheets-with-PHPIn this tutorial you will be create a web page and a couple of configuration files. For the purposes of this tutorial you should create a directory /graphtest/ directory under your web root directory.
This tutorial also assumes that you installed the graphing software directly under the web root
(e.g. /webRootFilePath/jpowered/graph/ )
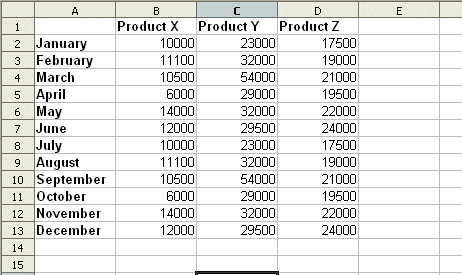
For this tutotial we shall create a simple MS Excel spreadsheet with the following layout in sheet 1:-

Once created, save this as "spreadsheet.xls" and place it on your web server in a directory /graphtest/ under your web root directory
Create a file named datafunction.php which contains the following:-
Again place this file on your web server in a directory /graphtest/ under your web root directory
Create a file named 'config.txt' and add the following contents to it. This file should then be placed in the /graphtest/ directory.
Note: This config.txt file contains the parameters which determine certain aspects of the graph
like colors and fonts. For the function and options of each parameter see the following page:-
Graph Parameters »
Add this HTML code to your page (replacing [www.YourDomain.com] with the actual domain of your web site. Place this page in the /graphtest/ directory.
Note:The relative file paths are relative to the location of the vertical-cylinder-graph.php file (they are NOT relative to the location of the web page).
Save the web page and load it up to your web server placing it in the /graphtest/ directory.
Open your web browser and view the page. You should see a Vertical Cylinder Graph with 36 bars plotted (12 for each series).
When the page loads the graph function is called which in turn runs the function contained within the datafunction.php file
This function then uses the PHP XL Reader to open and extract the data from the spreadsheet. Finally the data is passed to the graphing function and the graph is produced.
Constructing configuration dynamically
Creating Date/Time Axis Labels
Graphing Data Directly from Spreadsheets
Configuration Options and Parameters