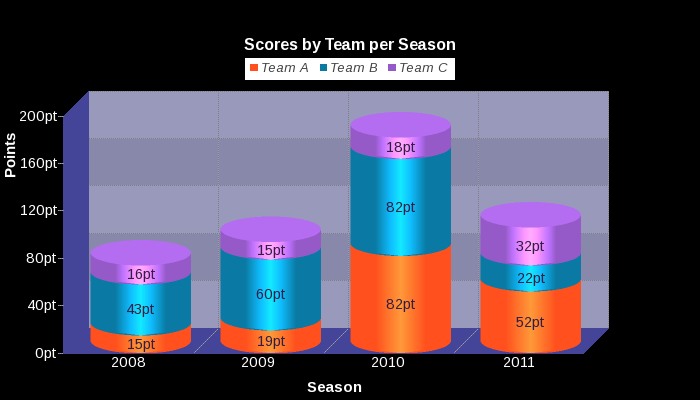
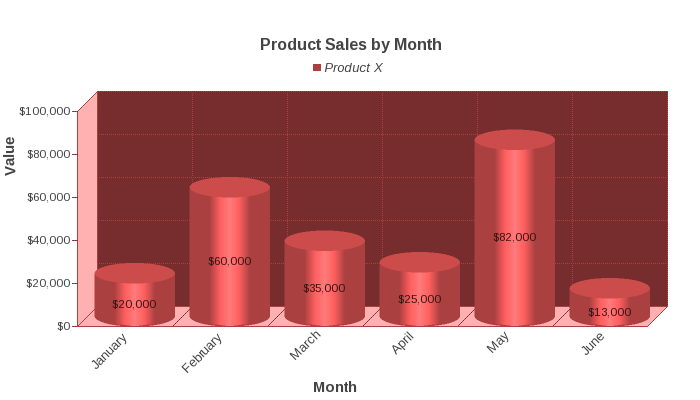
These examples show how the PHP Advanced Graph and charts software is used to dynamically produce stacked vertical cylinder graphs.
Here the graphing software is instructed to dynamically load the sales figures data and produce the area graph image in real time.

The graphing software is called at page load time by inserting a standard html img tag. The browser will issue the request to the graphing software for the graph image.
Again the graphing software is instructed to dynamically load data and produce the area graph image in real time.

The graphing software is called at page load time by inserting a standard html img tag. The browser will issue the request to the graphing software for the graph image.