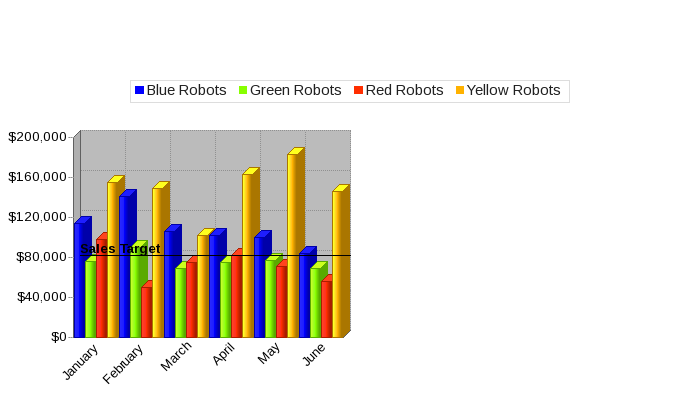
Here the graphing software is instructed to dynamically call at runtime a custom data script.
This method allows you to create your own PHP Scripts to produce the data to be graphed. This method can be used to acquire data from a database or any other data source to which your PHP environment has access.

The graph above is produced using the "Data Interface Script" method with the following IMG tag:-
The graph data is produced by the interface script and read by the graphing software at runtime:-
With this method the graphing software calls the interface script at runtime and reads the output of the script in the same way that it would read the data from a flat file. This method allows data to be dynamically produced and plotted in real-time.
The settings and styles are set from the information contained in the file:-
If the graph above does not display then see the Troubleshooting guide for details on how to resolve the problem.
If the graph above does display but no data is shown then the most likely cause is that the graph is having trouble connecting to the database server. Ensure that the 'Sample Application' has been set up with the correct DB User credentials.
If you have not yet set up the Sample Application then you can do so here.