3D Vertical Bar Graph

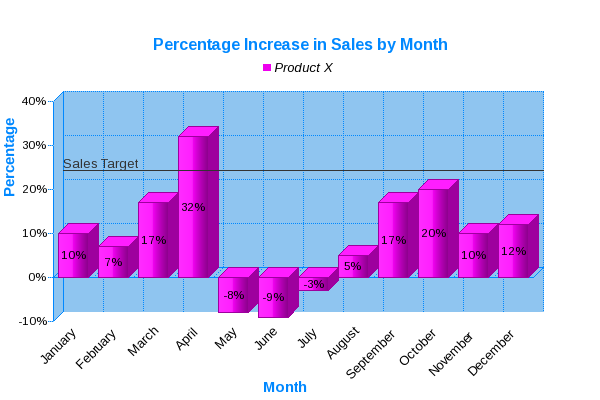
Bar graphs are a great way to group data and enable the viewer to make comparisons between those groups. In this first example the bar graph is used to show
the percentage increase / decrease in sales figures on a month by month basis. Note that in this exmample a 'Target' line has been added to provide the viewer
with another quick way to compare all the data against a general sales target.

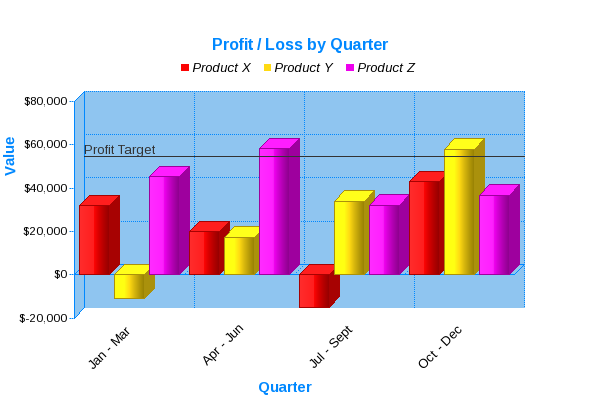
Bar graphs can also be used to display different series of data on the same chart. This example show the profit and loss figures for 3 products grouped by quarter
Graphs and Charts Software
JPowered provides software to enable web developers to easily incorporate dynamic graphs and charts into web sites and applications.
Web Page Graphing Software
PHP Graphing Software
Java Graphing Software
Full Documentation
PHP Graphing Documentation
Web Page Graphing Documentation
Java Graphing Documentation
Tutorials
A series of easy to follow Tutorials have been produced to enable quick development and show some of the more advanced
and dynamic applications.
PHP Graphing Tutorials
Web Page Graphing Tutorials
Java Graphing Tutorials

Benefits
- Easy to use and integrate
- Fully cross browser
- Platform independent
- Fully customizable
- Enhanced graphics and font rendering
- No client plugins required
- Highly efficient server side graphing
- Printer Friendly
- Dynamic graphing
- Direct database connections
- Technical Support
- Full documentation
- Comprehensive tutorials
- Sample applications
Top Features
- Over 30 chart styles
- 2D/3D Graphing
- Variety of Data Sources (Files, Databases, Scripts/Server processes, HTML parameters).
- Multiple Scales
- Target Lines
- Trend Lines
- Multiple Plots
- Configurable Grid
- Configurable Symbols
- Automatic Legend
- Label Orientation
- Configurable 3D effect
- Free Form Images
- Free Form Text

