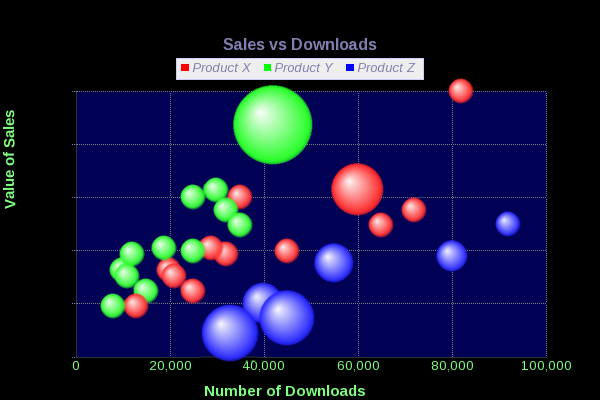
Bubble charts are used to plot data with 3 dimensions or properties. The first two elements are the represented by the X and Y co-ordinates whilst the 3rd property is represented by the size of the bubble. In this example we plot the 'Value of Sales' against the 'Number of Downloads' of a set of software products. The average value of a sale is represented by the size of each bubble.
JPowered provides software to enable web developers to easily incorporate dynamic graphs and charts into web sites and applications.
Web Page Graphing Documentation
A series of easy to follow Tutorials have been produced to enable quick development and show some of the more advanced and dynamic applications.