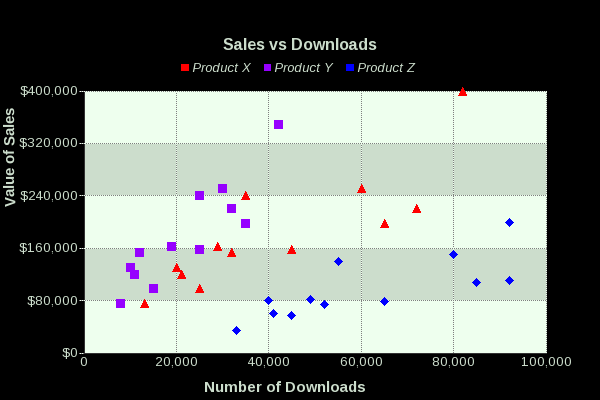
An X Y Scatter graph is a popular chart style used to show the distribution and clustering of data. The scatter graph is best used when there are many data items which not evenly distributed in any dimension. Once the points are plotted trends and patterns within the numbers can easily be seen by the viewer.
JPowered provides software to enable web developers to easily incorporate dynamic graphs and charts into web sites and applications.
Web Page Graphing Documentation
A series of easy to follow Tutorials have been produced to enable quick development and show some of the more advanced and dynamic applications.