Line Graph

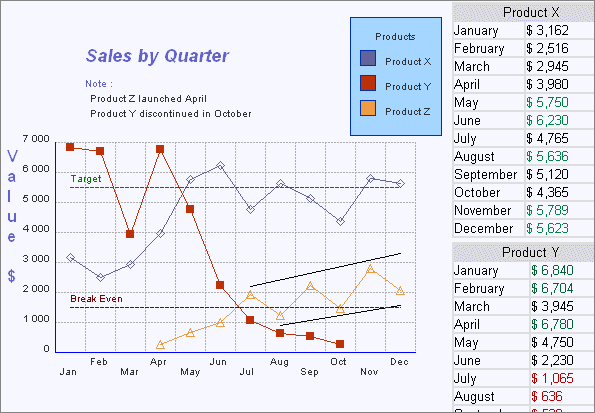
Line graphs are a very popular chart style and they are very good are highlighting trends within data, usually over time. This example
plots sales figures by month. The trends for each of the three products can clearly be seen as sales progress throughout the year. To aid the viewer and provide
additional context trend lines have been added to key areas of the graph image. This example also demonstrates the use of target lines, in this case to
highlight the a 'Break Even' and 'Sales Target'. In this way the line graph clearly shows when sales targets have been met and when a product is making a loss.
Graphs and Charts Software
JPowered provides software to enable web developers to easily incorporate dynamic graphs and charts into web sites and applications.
Web Page Graphing Software
PHP Graphing Software
Java Graphing Software
Full Documentation
PHP Graphing Documentation
Web Page Graphing Documentation
Java Graphing Documentation
Tutorials
A series of easy to follow Tutorials have been produced to enable quick development and show some of the more advanced
and dynamic applications.
PHP Graphing Tutorials
Web Page Graphing Tutorials
Java Graphing Tutorials

Benefits
- Easy to use and integrate
- Fully cross browser
- Platform independent
- Fully customizable
- Enhanced graphics and font rendering
- No client plugins required
- Highly efficient server side graphing
- Printer Friendly
- Dynamic graphing
- Direct database connections
- Technical Support
- Full documentation
- Comprehensive tutorials
- Sample applications
Top Features
- Over 30 chart styles
- 2D/3D Graphing
- Variety of Data Sources (Files, Databases, Scripts/Server processes, HTML parameters).
- Multiple Scales
- Target Lines
- Trend Lines
- Multiple Plots
- Configurable Grid
- Configurable Symbols
- Automatic Legend
- Label Orientation
- Configurable 3D effect
- Free Form Images
- Free Form Text
